Data Center
Get a graphical overview of your device’s operating history, including usage time and alarm charts.
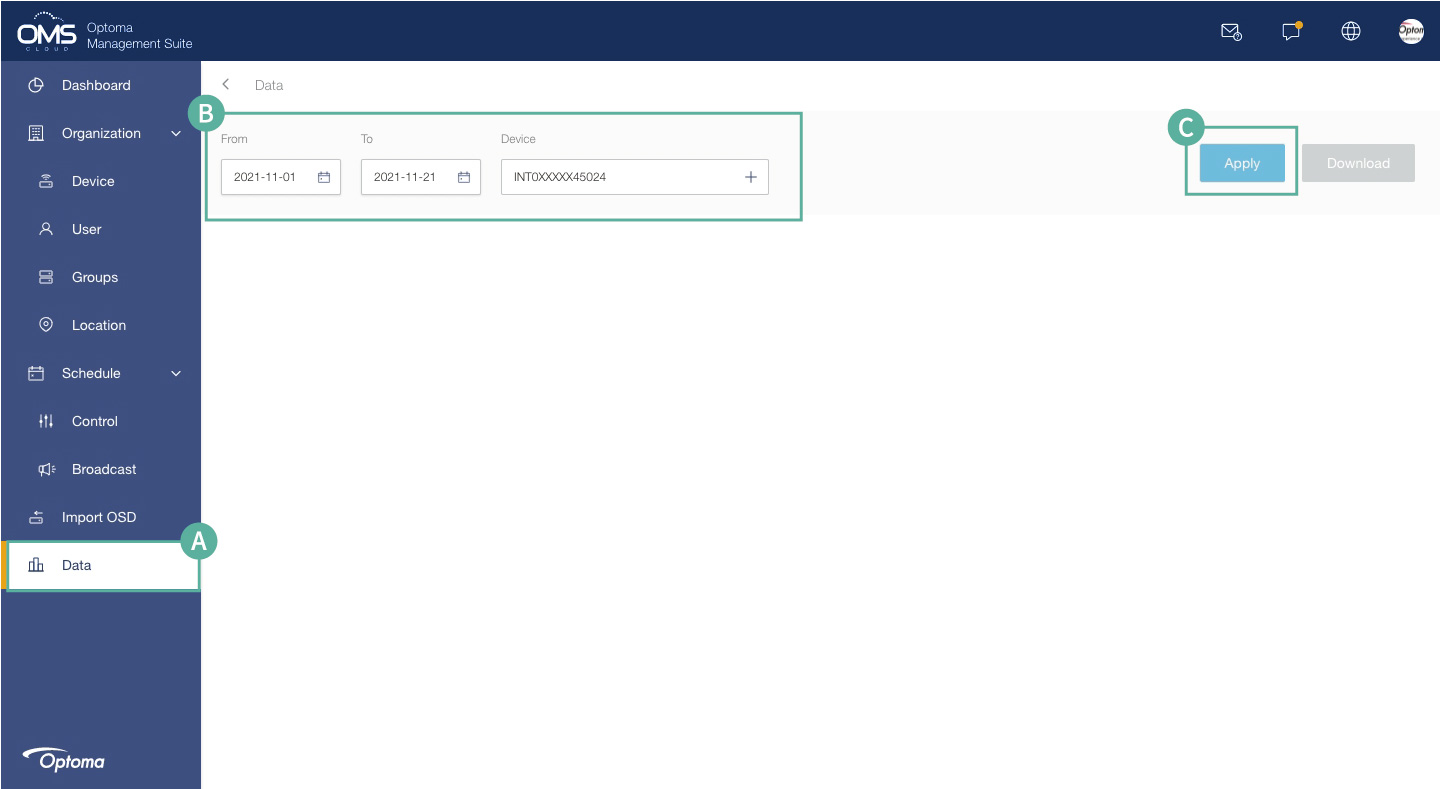
A Click Data
B Choose Period and Device
*30-day reporting is currently supported.
C Click Apply

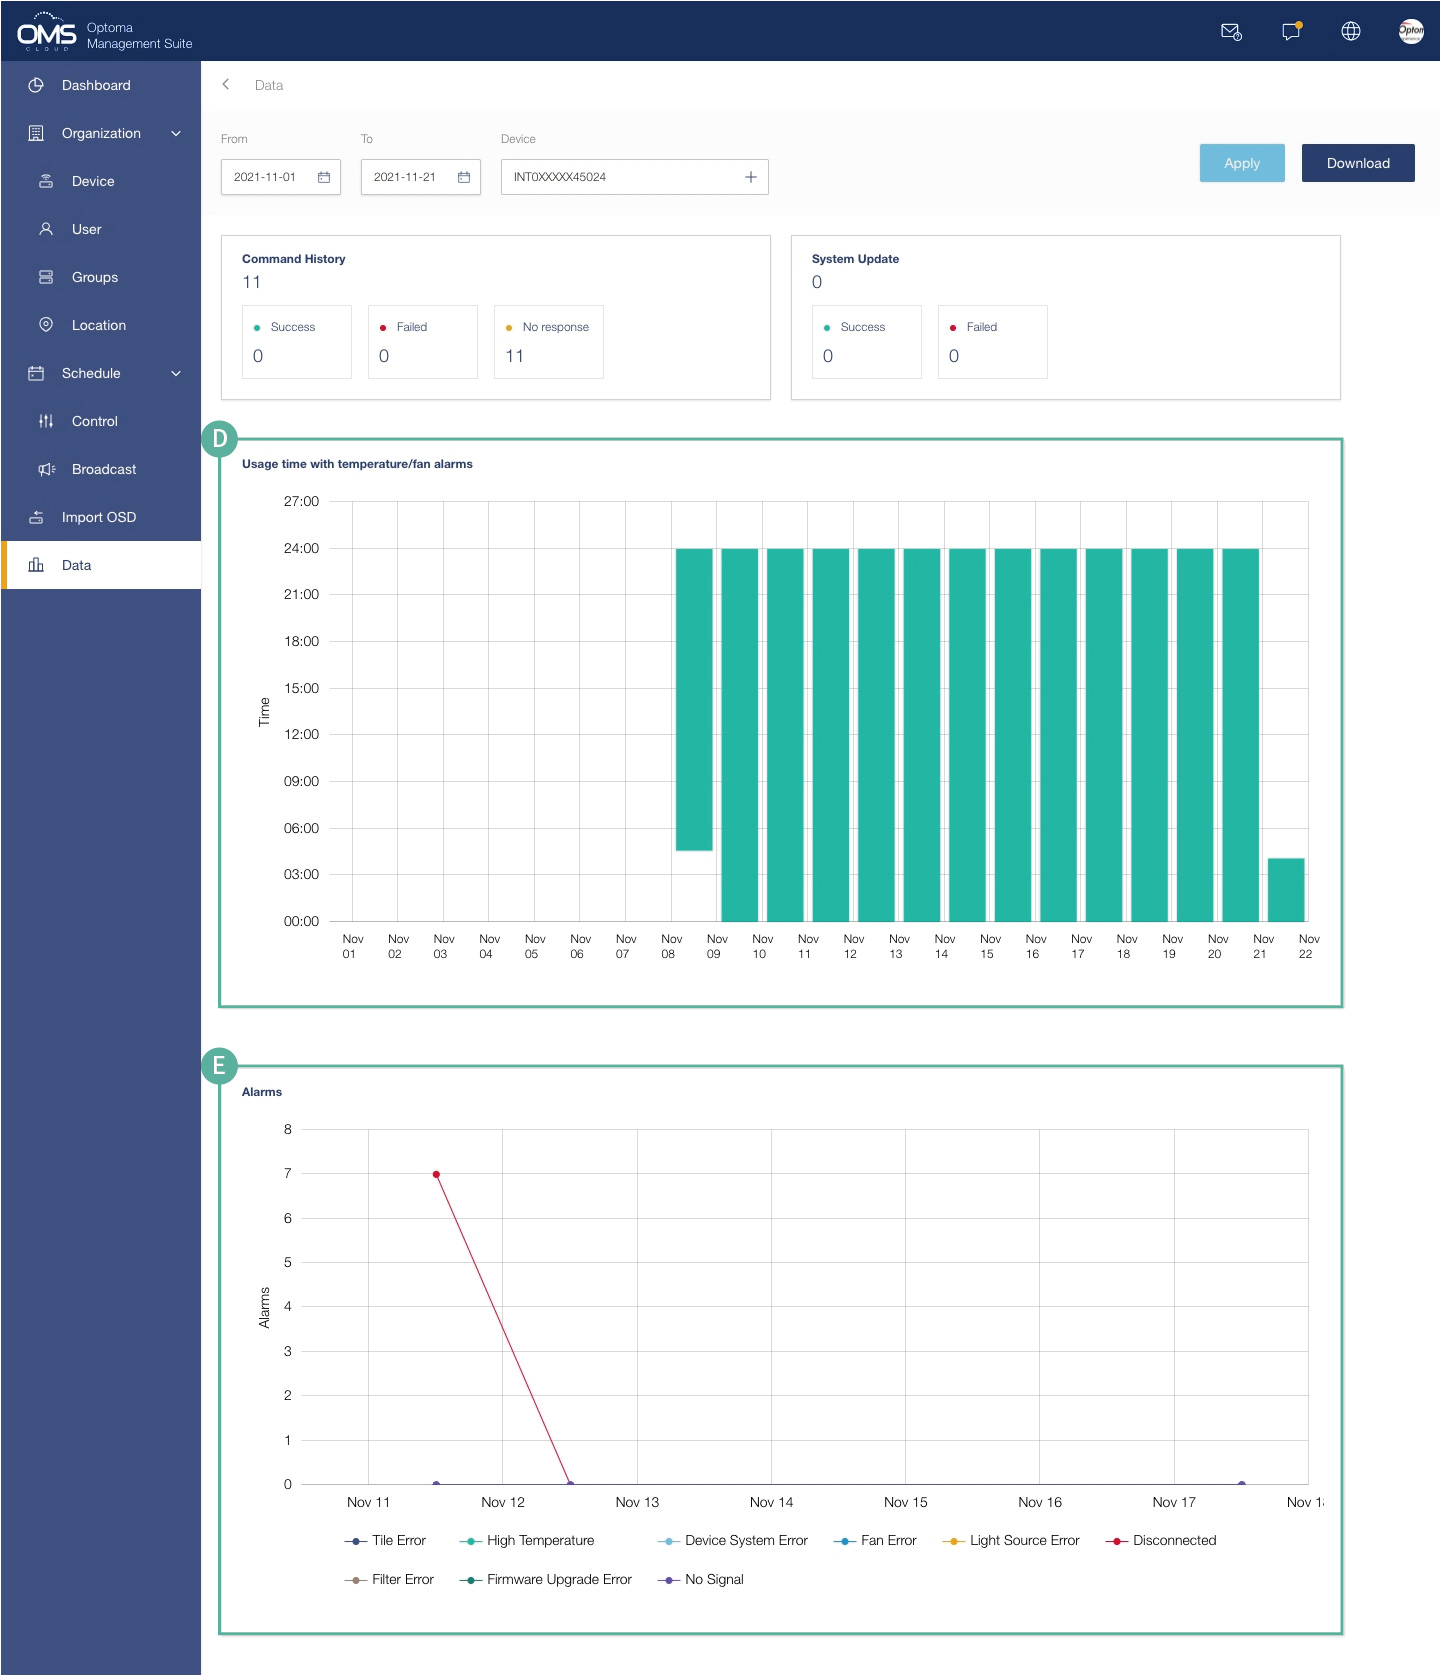
D Device usage time and temperature/fan error chart
E Alarm history chart

Notification Setting
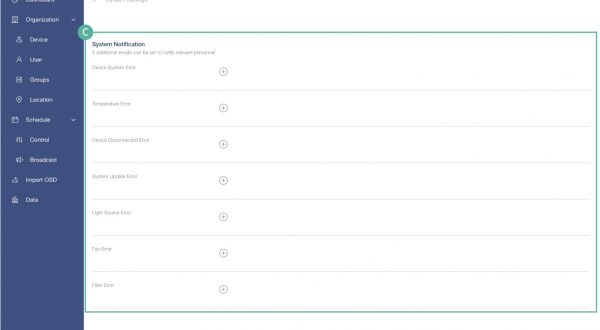
Alert Notification Email Settings
Abnormal alarms are notified in a timely manner, which can be handled in time before the problem is escalated.
A Click Profile icon in the upper right corner
B Click System Setting

C 5 additional emails can be added per alert

這篇文章有幫助嗎?
如果你覺得這篇文章有幫助,請讓我們知道。
